The Animation Wasn't Where the Time Went
A chart redraws at 5 Hz while its y-axis rescales. Animating the rescale as a composited transform, instead of re-rendering every frame, cut main-thread work by roughly two-thirds. The costs I braced for never fired. The redraw itself dominated.
- performance
- react
- web-animations-api
- svg
- rendering
A chart that never holds still has two clocks. New data lands several times a second and the plot redraws: in the rig I will use here, about 200 points and a fitted curve at 5 Hz. Separately from that, the y-axis occasionally rescales when the reader changes what it spans, and I want that rescale to glide rather than jump.
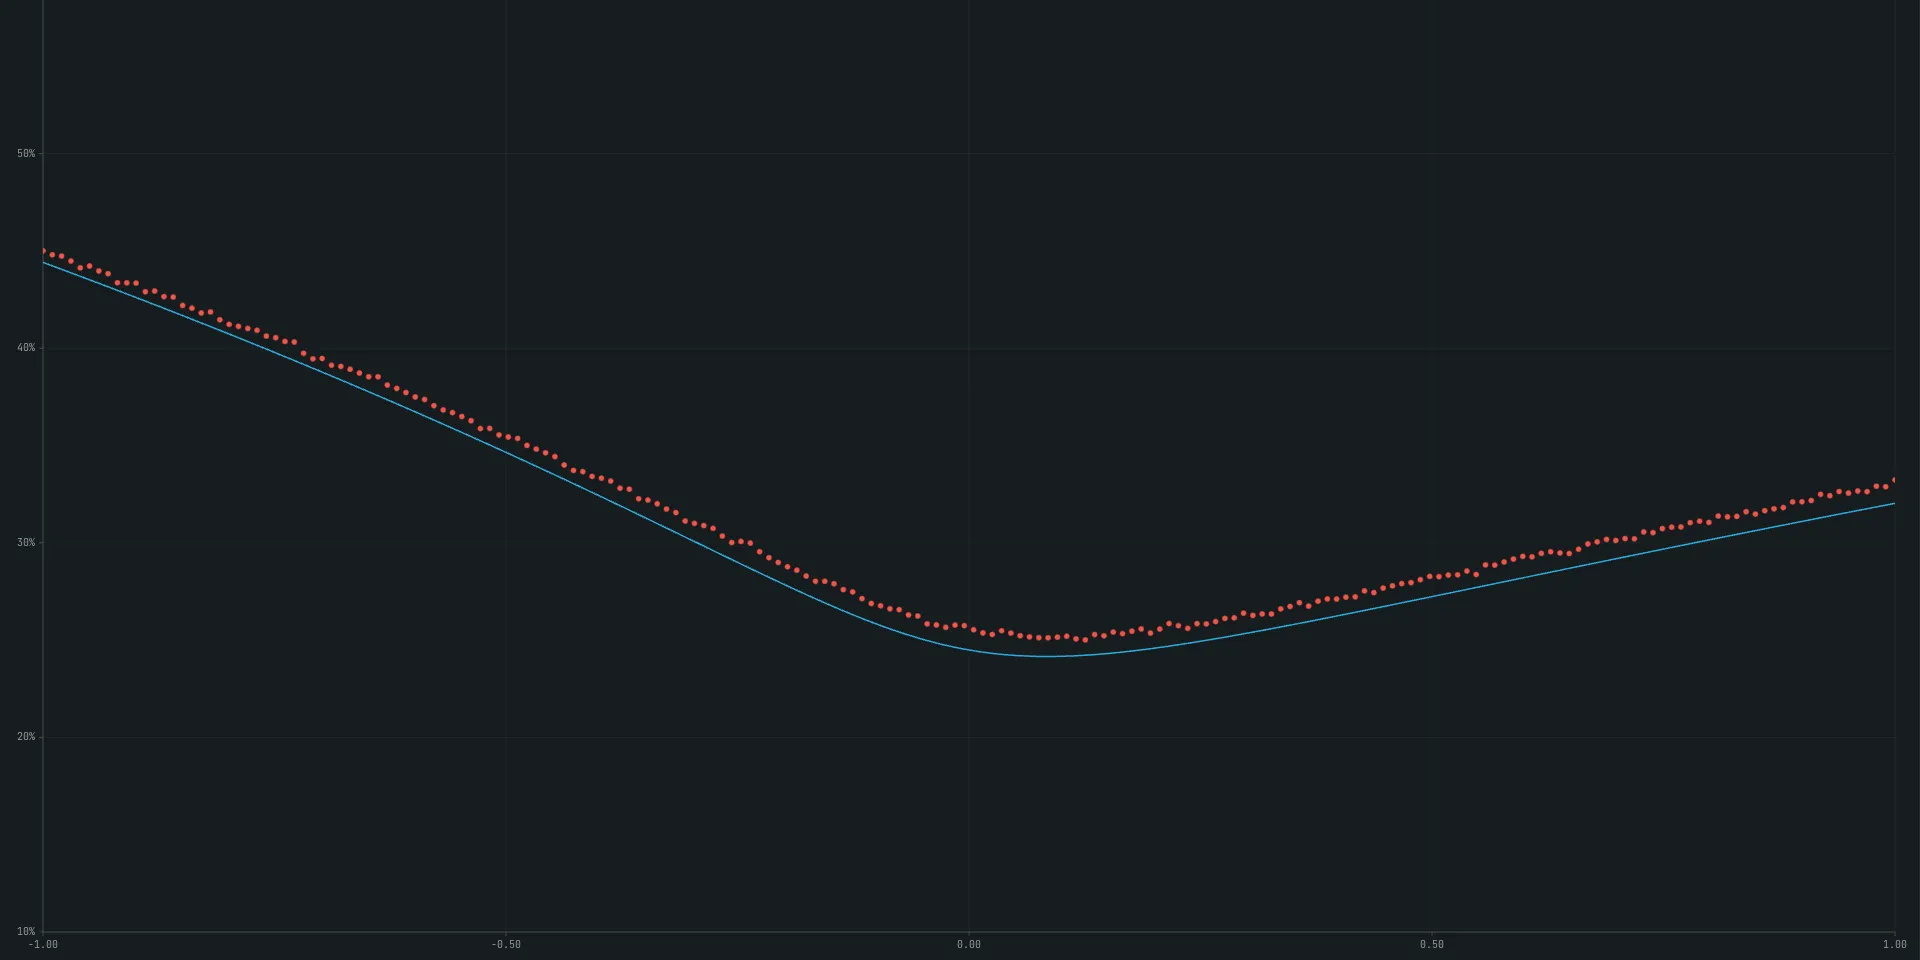
So two things happen on the same element at once: a transform animation (the rescale) and a high-frequency content update (the redraw). The instinct is that the hard part is keeping the animation cheap while the redraw keeps firing. I built a rig to measure it, and the instinct pointed at the wrong thing. A transform, handed to the compositor, stays cheap even while the chart redraws at 5 Hz, and the two layout costs I braced for came to nothing. The bill was the redraw itself.
The naive rescale: interpolate on the main thread
The obvious way to animate a range change is to interpolate it yourself. On each
requestAnimationFrame, compute an intermediate range and re-render the chart at
it. It works, and it looks smooth.
It also runs the entire animation on the main thread. Every frame recomputes the scales and rebuilds the plot, which is the same redraw cost you already pay at 5 Hz, now paid at 60 Hz for the length of the transition. For that window the animation competes for the main thread with the very updates it is animating over.
Measurements come from a production-built Chrome rig reproducing the workload of the live demo (about 200 moving nodes and a transform rescale, no CPU throttling). Each figure below is total main-thread time accumulated over a five second trace, not a per-frame or per-second number:
Scripting Rendering Painting ~main threadrAF (per-frame) 43 ms 48 ms 16 ms ~107 msWAAPI transform 17 ms 19 ms 4 ms ~40 msThe fix: a composited transform, on an element that can take it
The rescale is, geometrically, a pure transform. Re-render the content at the
new range immediately, then animate a translateY and scaleY from the value
that makes the new layout look like the old range back to identity. Two things
have to hold for that to stay off the main thread, and the second is easy to miss.
First, animate transform only, and let React commit once. The keyframes touch
nothing but transform; React renders the chart a single time, at the new range,
then stays out of the transition. That alone is most of the drop from 107 ms to
40 ms: the main thread stops rebuilding the chart sixty times a second.
Second, animate an element the compositor will actually promote. Chrome runs
transform animations on the compositor for HTML and replaced elements, but not for
SVG child elements. Put the animation on an inner <g> and it falls back to
per-frame main-thread layout, silently, with no warning. So the chart is two
layers: a static base SVG for the axes and grid, and an interior layer for the
dots, curve and cursor, wrapped in an HTML <div>. The transform animates the
<div>.
// yRange changed. The interior is already re-rendered at the new range;// animate the wrapper from "looks like the old range" to identity.const sy = (newMax - newMin) / (oldMax - oldMin);const ty =  MARGIN.top * (1 - sy) + (innerH * (oldMax - newMax)) / (oldMax - oldMin);
// `layer` is the HTML wrapper around the interior SVG, pinned over the// base with `inset-0` and `transform-origin: 0 0`, so the maths is the// same as it would be in the SVG view-box.layer.animate(  [    { transform: `translateY(${ty}px) scaleY(${sy})` },    { transform: "translateY(0px) scaleY(1)" },  ],  { duration: 300, easing: "cubic-bezier(.4, 0, .2, 1)", fill: "forwards" },);
With both in place the main thread hands off once and goes quiet: the two keyframes interpolate on the compositor’s own thread while the main thread carries only the 5 Hz baseline. The picture on screen is identical; what dropped is main-thread work, not a jump in frame rate.
Confirm it composited; the Animations lane will not tell you. This is the step
that is easy to skip, because a transform animation shows up in DevTools’
Animations lane whether or not it is on the compositor. The real check is the
animation event in a trace: its compositeFailed field reads zero when the
animation is composited, and a non-zero bitmask of reasons when it is not. The
inner <g> reports a non-zero value; the HTML wrapper reports zero. Skip the
check and it is easy to ship a “compositor” animation that is quietly running on
the main thread, costing a little layout on every frame.
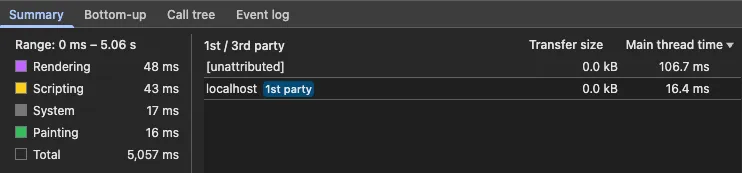
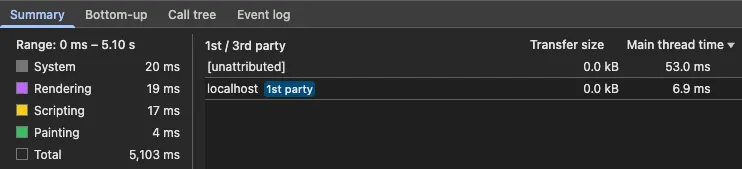
The absolute figures are small because this workload is modest. What matters is where the work lands and how it scales: on the main thread, cost grows with redraw frequency and node count. On the compositor, the transform is largely independent of both.
Two layout costs that didn’t bite
Both are versions of the same worry: the browser quietly redoing layout, the pass that works out where every element sits, on each one of those 5 Hz frames. On a hot path that is exactly the kind of cost that hides. I built the rig partly to catch them. Neither fired.
The forced reflow. Layout is normally batched: your code can change a hundred things and the browser works out the new geometry once, just before it paints. But the moment your code reads a geometry value back (an element’s position or size), the browser has to stop and compute layout right then. That synchronous, on-demand layout is a forced reflow, and on a hot path it is a classic offender. A CSS-transition build of the rescale includes one: it commits the start state with a geometry read before the transition begins.
It does not cost, and the reason is specific. The thing being animated is a
composited transform, which the browser resolves without touching layout. So
when the code forces the read, the transform has invalidated no layout; the read
just pulls forward the layout the redraw would do that frame anyway. It reorders
work, it does not add it. The two builds come out indistinguishable: 2.5 ms of
layout against 2.2 ms over five seconds. A forced reflow only bites when it makes
layout run twice (read, change something that invalidates layout, read again).
This one runs it once.

The moving reference box. A transform scales and moves an element around a
reference box. Tie that box to the element’s own content and, next to a constant
redraw, it looks like a trap: a box that wraps content shifting every frame shifts
too, and the browser might re-resolve the transform against it each time, layout
on every redraw. The HTML wrapper closes this off by construction. Its reference
box is the chart rectangle, pinned by inset-0; it does not track the dots moving
inside it, so there is nothing to re-resolve.
Where the cost actually is
With the animation handed off and the two suspected costs ruled out, the trace
points somewhere flat and unglamorous. The dominant per-redraw cost is
setAttribute and Recalculate style, together around a third of main-thread time:
mutating a couple of hundred SVG nodes’ geometry five times a second, and the
style invalidation that follows. It is identical across every build, because it
has nothing to do with how the rescale is animated.
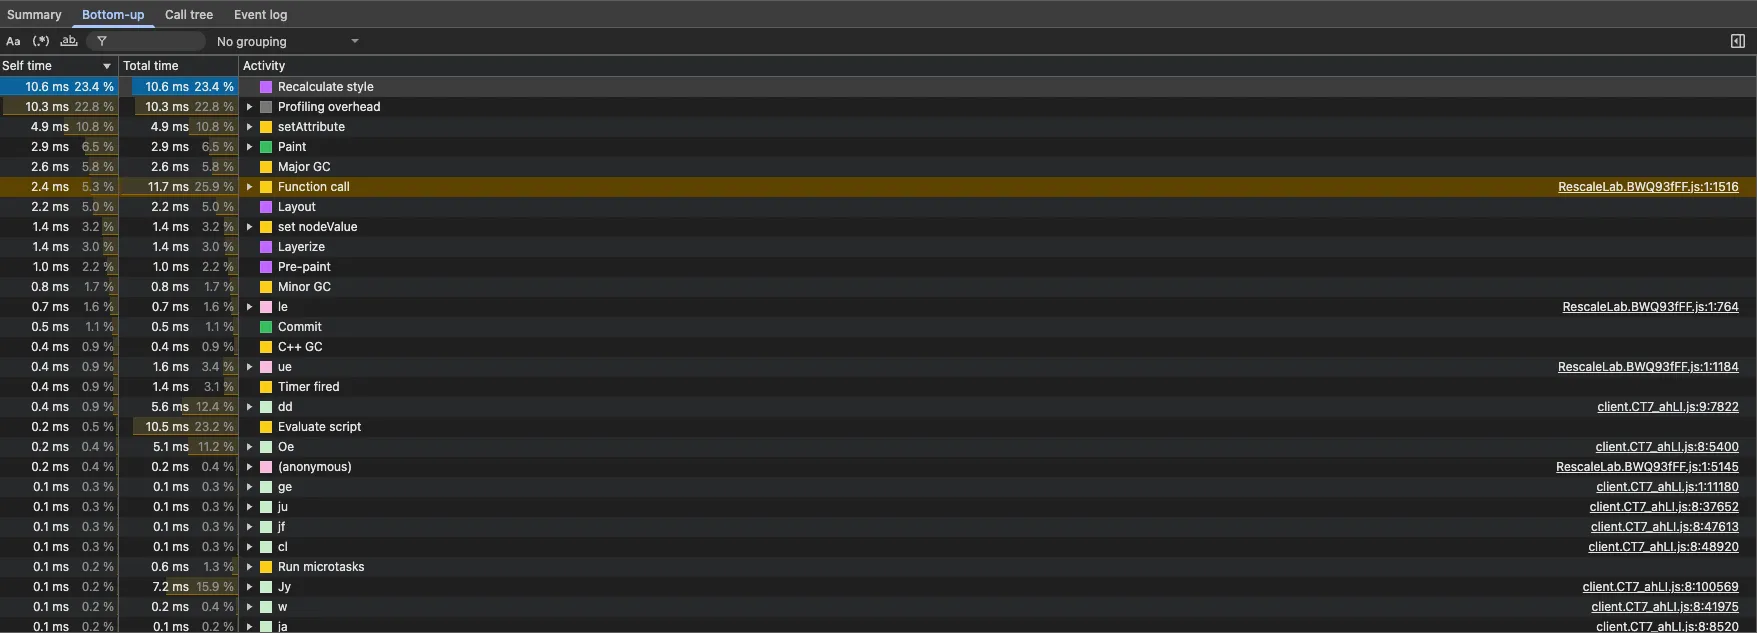
The lever, then, is the redraw, not the transition: fewer nodes, batched attribute writes, or a different rendering substrate such as canvas. Not the animation, which is free once it is on the compositor, and not the reference box, which was never doing what I thought.
What I would take from this
Compositor-only is the right instinct, and it paid off: the rescale belongs on the
compositor, and putting it there, on an element that could take it, dropped
main-thread work from about 107 ms to 40 ms over the trace. Two qualifications
matter as much as the headline. First, “animate transform and opacity” is
necessary, not sufficient: the element has to be one the compositor will promote,
and an SVG child is not, so confirm it with the compositeFailed flag rather than
trusting the Animations lane. Second, the costs I was most sure about either
reorder into nothing or never fire, and the one that dominated is the plain one I
had stopped looking at: SVG mutation and style recalculation, roughly a third of
main-thread time, untouched by anything I did to the animation.
A plausible mechanism and a measured cost are different things. Only the trace tells you which is which.
Notes
Under prefers-reduced-motion: reduce the animation runs with duration: 0,
snapping to the final state: the motion is a visual aid, not load-bearing. A
rescale that arrives before the last one finishes cancels the in-flight animation
and starts fresh, and the animation is cancelled on unmount, which keeps it
correct under React’s double-mount in development.
The MDN Web Animations API reference
covers the Element.animate handoff used here. The trace-reading this post leans
on, three competing rates and the gaps between them, is written up as a method in
How to Profile a Real-Time UI.